Summary
Learn more: click on links below to learn more about each type of visual aid.
Introduction
Studying is a necessary part of academic life, but it can often feel monotonous and tedious. Fortunately, there are ways to make the process more engaging and effective. Visual aids are a powerful tool to boost your study game, and they can help you better understand and retain complex information. By incorporating images, diagrams, graphs, charts, and other visual elements into your study routine, you can enhance your learning experience and achieve better results.
Visual aids are particularly helpful for visual learners who process information more effectively through images and graphics than through words alone. However, even if you are not a visual learner, visual aids can still be beneficial by breaking down complex concepts into simpler, more digestible parts. They also help to create associations between ideas and reinforce your understanding of key concepts. In this blog post, we will explore the benefits of using visual aids in your studying, and offer tips for incorporating them into your routine.
Some examples of visual aids
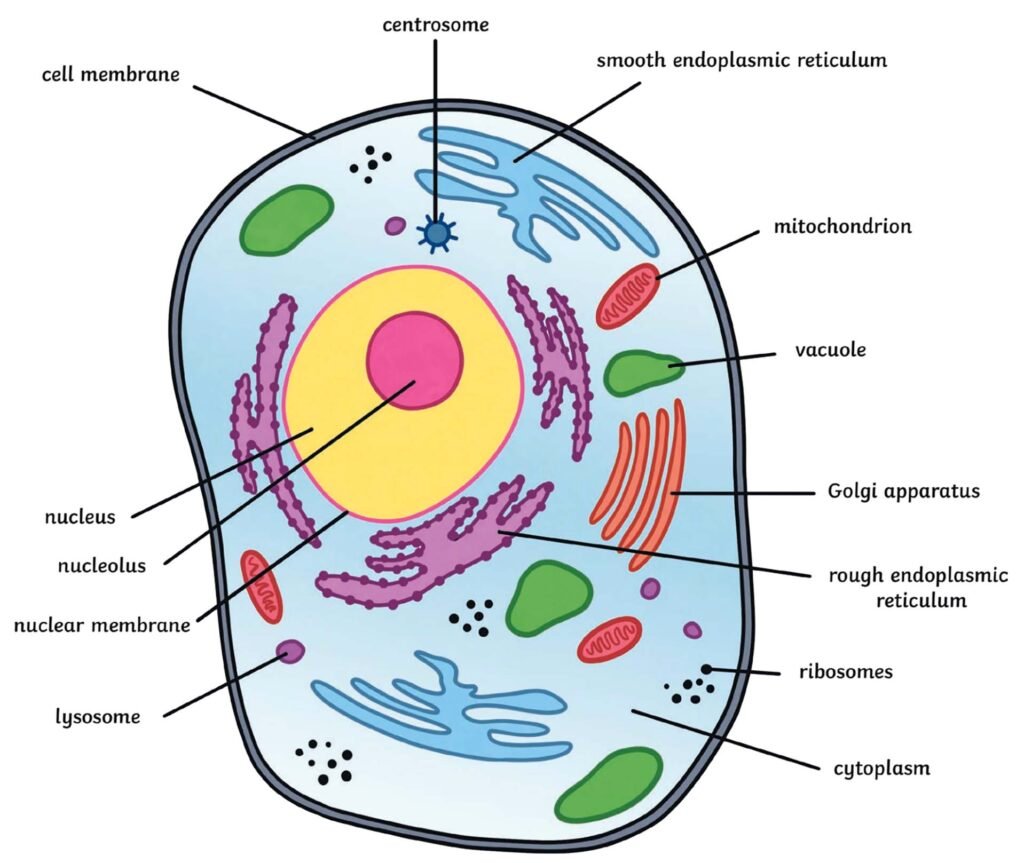
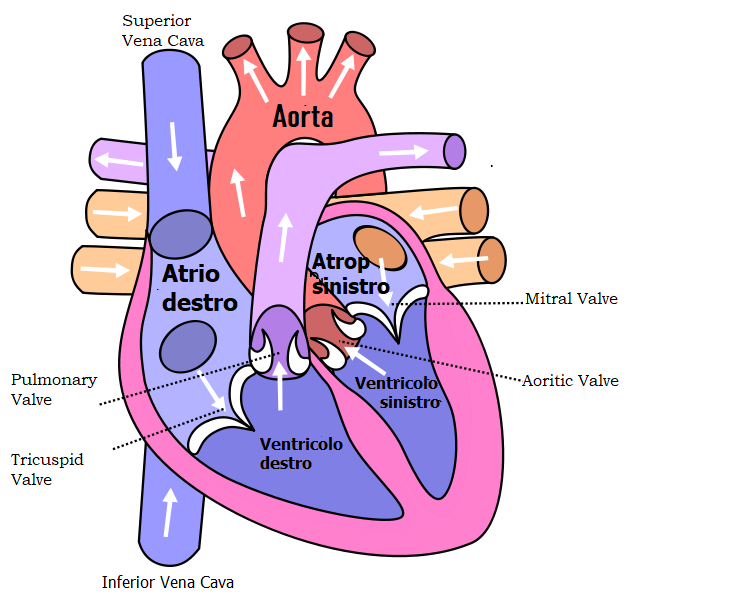
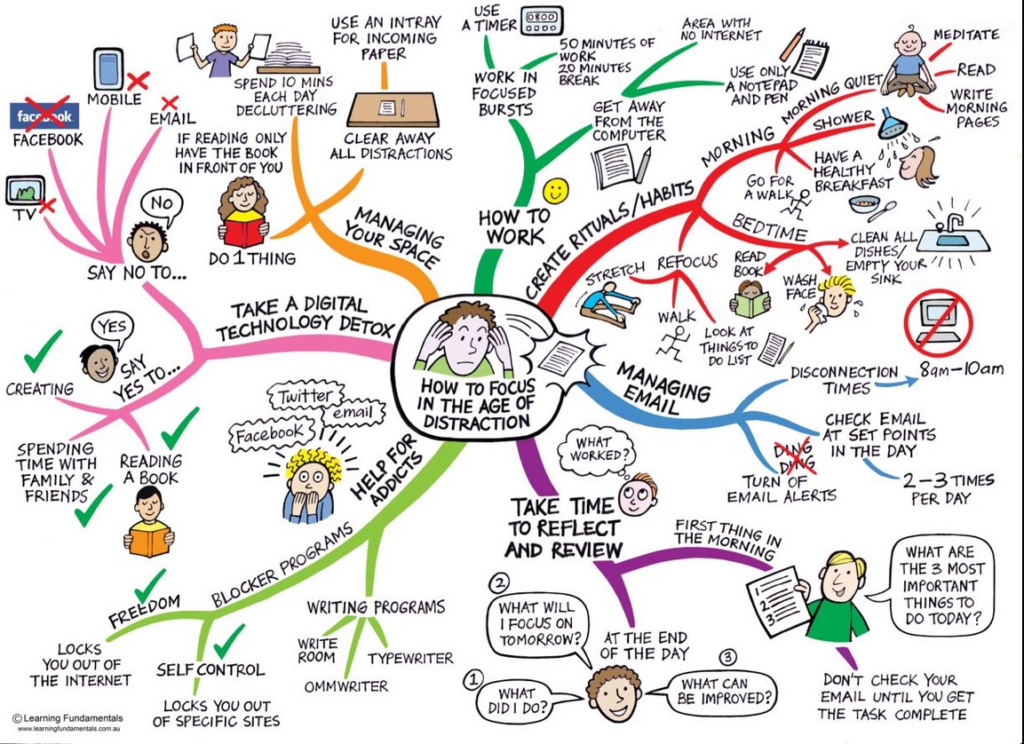
Here are some examples of visual aids you can use in your studies or draw for yourself. Some visual aids are available in books, online, or you can use your text to create them.

Animal Cell Diagram


Incorporating Visual Aids in your study routine
Use diagrams and charts.
Many students find it a struggle to remember large amounts of information when most need. Visual learners also find reading pages of dense text overwhelming and demotivating. These students need help focusing on engaging pieces of information that is not only enjoyable, but could enhance their memory.
Fortunately, Diagrams and charts can give students variety and interest in their studies and help them boast their study game. Diagrams and charts can help you break down complex information into more manageable pieces that can help the brain better understand and retain it. They are especially useful in science and mathematics subjects. They can be used to help students understand patterns and connections between different pieces of information. Charts can help students prepare confidently for their exams.
Create visual summaries of concepts.
Another way to use visual aids is by creating visual summaries of complex information. Key points are easier to remember when presented in the form of diagrams, mind maps, flowcharts, infographics, even simple pictures. The key is to find a format that works best for you and the type of information you are studying. It is also a great way to organize information, to build creativitly, and to develop critical thinking skills. The information first has to be understood in order to do this. Together the various parts of the summary fit together perfectly. This visual representation of information helps you retain informationn quickly, because the condense information is creating a roadmap or a mental mape for your brain to follow instead of just following pages of written text.
One of the great things about visual summaries is that they can be customized to suit your learning style. If you are a visual learner, then creating your own visual summaries will be especially helpful. But even if you are not a visual learner, creating a visual summary can still be a powerful tool. By engaging with the information in a different way, you are more likely to remember it and understand it on a deeper level. There are many different ways to create visual summaries. Some people prefer to use color-coded diagrams or mind maps.
Incorporate mind maps for brainstorming and for effective studying.

Mind maps are a graphical representation of ideas or concepts that help learners organize and connect information visually. They are an excellent way to enhance your study process by making it more interactive and engaging. One of the significant benefits of mind maps is that they help learners to break down complex ideas into smaller, more manageable pieces.
For instance, if you are studying a complicated topic in history, creating a mind map can help you to group related ideas into sub-topics and organize them in a logical sequence. This process allows you to see the big picture of the topic and understand how each idea relates to each other. Mind maps are also an excellent way to stimulate creativity and critical thinking.
By visually connecting different ideas and concepts, you may come up with unique solutions or perspectives that you may have missed otherwise. This process of brainstorming can help you to generate new ideas and insights, which can be helpful when tackling complex problems.
Another benefit of using mind maps is that they are easy to customize and update. As you continue to learn and grow, you can add new ideas or modify existing ones as needed. This flexibility allows you to adapt and gain more from your reading sources.
The use of mind maps is particularly useful when brainstorming. When preparing for an essay, for example, it’s easy to get overwhelmed by the amount of information you need to cover. By creating a mind map, you can break down the topic into smaller, more manageable pieces. This allows you to see the connections between different ideas and helps you to identify any gaps in your knowledge.
Another benefit of using visual aids such as mind maps is that they can help you to remember information more easily. When you create a mind map, you are actively engaging with the material and organizing it in a way that makes sense to you. This helps to encode the information into your brain in an engaging way while making it easier to recall information later on.
Use infographics for complex data.
Visual aids are an effective tool for improving the learning process, and infographics are an excellent way to communicate complex data. With the increasing amount of information available to students, it has become crucial to present data in a way that is easy to understand and digest. Infographics have proven to be a great way to achieve this, and students can use them to boost their study game.
Infographics are essentially graphical representations of data or information. They are designed to convey complex information in a simple and visually appealing way. Unlike text, which can be dense and difficult to understand, infographics use colors, shapes, and icons to break down information and make it more accessible. This visual approach to learning is helpful, especially for students who are visual learners. One of the best ways to use infographics for studying is to apply them to complex data.
For example, instead of studying a long and complicated text on the human body, students can use an infographic to help them understand the different organs, their locations, and their functions. This approach breaks down the data into easily digestible chunks, which makes it easier to understand and remember. Moreover, infographics can help students to organize and retain information better.
The use of infographics also enhances the retention of information. Studies have shown that people retain 65% more information when it’s presented with an image than when it’s presented as text alone. The human brain processes images more efficiently than text, making it easier to remember the information.
Additionally, infographics are more engaging than text, making them more memorable. Creating infographics is also a useful study technique. When students create their own infographics, they have to break down the information into the most critical points. This process helps students understand the material better.
Utilize video for dynamic learning.
Visual aids are an excellent way to boost your study game and enhance your learning experience. One of the most effective visual aids is video content. Videos are an engaging and dynamic way of learning, making them a perfect study tip for students of all ages. Visual aids, such as videos, can help you better understand complex concepts and retain the information for a more extended period.
Utilizing video content as a study tip can help you learn in a way that is both enjoyable and effective. Videos can help you visualize the information you are learning, making it easier to comprehend and remember. They can help you break down complex topics into more manageable segments and provide a step-by-step explanation of the subject matter. Moreover, videos are a versatile tool in the learning process. You can use them to review previous lessons, gain a deeper understanding of new topics, or even teach yourself new skills.
With the rise of online learning resources, such as YouTube and Khan Academy, students now have access to a vast library of video content covering a wide range of subjects. Another benefit of using videos as a study tip is that it can be a more efficient and time-effective way of learning. Instead of spending hours reading through textbooks, students can watch a 10-minute video that covers complex topics in a concrete way.
Videos can be used to explain difficult concepts, provide visual demonstrations, and bring real-life scenarios to the forefront. This can help you understand abstract ideas and concepts that may be difficult to grasp through reading alone.
Another benefit of using video for studying is that it caters to different learning styles. Some people learn better through visual stimulation rather than traditional reading and writing methods. For instance, visual learners may find it easier to understand a topic by watching a video rather than reading a textbook. Videos can also provide a break from traditional study methods, making the process more enjoyable and less monotonous. Watching a video can be more entertaining than simply reading a chapter, and this can help keep you engaged and motivated.
Moreover, videos can be used to create a collaborative learning environment. You can share videos with your classmates or study group, and discuss the content together. This can enhance not only understanding, but verbal expression of various topics. This will allow different learning styles to interact and share their knowledge of varous topics.
Use flowcharts to organize ideas.
Another visual aid is flowcharts. Flowcharts are diagrams that depict a process or system in a graphic format, and can be used to organize ideas and concepts. They help you organize ideas, by taking complex information and breaking it down into smaller subtopics or concepts that are related to the main idea. You can then use shapes such as rectangles, circles, and diamonds to represent each subtopic or concept, and connect them with lines to show how they are related. By doing this, you can create a clear and organized representation of the information that you are studying.
The use of flowcharts can be helpful in several ways.
- They allow students to visually see the connections between different ideas. By creating a flowchart, students can see how different concepts are related to one another and how they fit into the overall structure of a topic or subject. This can make it easier to remember information and to understand complex ideas.
- Another benefit of using flowcharts is that they can help students to identify gaps in their understanding. When creating a flowchart, students may notice areas where they are missing information or where their understanding is unclear. This can prompt them to go back and review those areas, leading to a deeper and more thorough understanding of the material.
- Flowcharts can also be used as a study aid when preparing for exams. By creating a flowchart of key concepts or topics, students can review the material in a concise and organized manner. This can help to reinforce their understanding of the material and improve their ability to recall these concepts.
Conclusion
And there you have it, folks! A fun and easy way to amp up your study game. By incorporating visual aids like diagrams, mind maps, and flashcards, you can not only boost your memory retention but also make studying a more enjoyable experience. So, why not give it a try? Get creative, have some fun, and watch as your grades soar! Happy studying!
